7 Best Conductive Glass Display Sensors for Global Buyers
The global market for interactive displays is moving beyond simple touch panels. Fortune Business Insights estimates that the global touchscreen market could reach approximately USD 166 billion by 2032, supported by rising demand in automotive, industrial, medical, retail, and consumer electronics applications. Omdia’s display research also highlights continued growth in larger, brighter, and more interactive vehicle screens. These trends create a practical need for reliable conductive glass display sensors that can detect touch accurately through thin, durable surfaces.
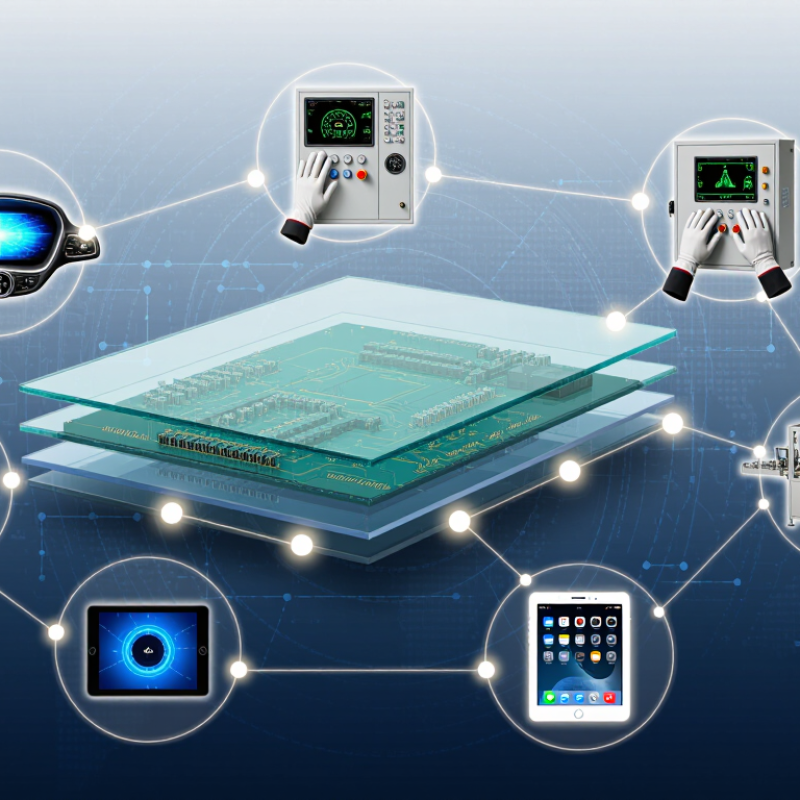
A conductive glass display sensor combines transparent conductive layers with a glass interface. Its performance depends on sensitivity, optical clarity, response time, durability, and resistance to moisture or electromagnetic interference. Display Supply Chain Consultants founder Ross Young has often emphasized the display’s central role in device interaction, stating, “The display is the most important component in a smartphone.” That principle now applies to dashboards, kiosks, smart appliances, and factory terminals.
This guide reviews seven leading sensor options for global buyers. It considers measurable specifications, application fit, integration support, supply stability, and total ownership cost. Real-world details matter, such as whether a gloved operator can activate a control in a cold warehouse. So does long-term consistency.
No ranking is perfect. Supplier data can vary, and laboratory performance may not match field conditions. Buyers should verify samples, certification records, controller compatibility, and production capacity before committing. The strongest Conductive Glass Display Sensor is not always the most expensive one. It is the one that remains accurate, clear, and dependable in its intended environment.
Conductive-Glass Basics: ITO at 10–100 Ω/□ and ≥85% Transmittance
For global buyers comparing seven conductive glass display sensors, ITO performance starts with two measurable values: sheet resistance and optical transmittance. A practical target is 10–100 Ω/□ with at least 85% transmittance. Lower resistance can improve signal stability, but it may reduce transparency or increase coating cost. Testing matters.
In real projects, measure resistance across several points, not only the center. A four-point probe can reveal uneven coating near corners and edges. Check transmittance with the intended glass thickness and wavelength range. A clear panel under showroom lighting may perform differently beside a bright outdoor window. That detail is easy to miss. Buyers should also confirm touch sensitivity, surface hardness, humidity resistance, and connector compatibility before approval.
Tips: Request a test report, coating uniformity map, and sample panels. Compare readings after cleaning and temperature cycling. Keep acceptance limits written in the purchase specification. ITO is proven, but it is not perfect; thin coatings can show drift after repeated flexing or poor handling. Ask suppliers how they control glass washing, sputtering, annealing, and final inspection. A slightly higher resistance value may still work well when controller design, electrode layout, and cable length are properly matched. 天天中彩票追号
Seven Sensor Choices Compared by Accuracy, Latency, Durability, and Cost
Selecting a conductive glass display sensor requires more than checking its advertised sensitivity. Accuracy, latency, durability, and cost can change sharply after installation. Choice one, mutual-capacitive sensing, offers high accuracy and near-instant response, but costs more. Choice two, projected-capacitive sensing, supports multi-touch and gloved operation, though thick cover glass may reduce precision. Choice three, self-capacitive sensing, is affordable and responsive for simple controls, but nearby fingers can create false inputs. Choice four, resistive sensing, remains cost-efficient and works with almost any stylus, yet its slower response and softer surface reduce durability. Choice five, infrared touch sensing, provides strong optical accuracy and works through thicker glass, but dust can increase maintenance. Choice six, surface-acoustic sensing, delivers clear touch detection and good image clarity, although moisture may affect reliability. Choice seven, hybrid conductive sensing, balances speed, durability, and price, but calibration is more demanding.
Tips: Test every option with the actual display stack. Use a gloved finger, a wet fingertip, and a metal stylus. Record response latency at the screen edges, not only the center. A 10-millisecond result in a laboratory may become slower behind laminated glass. Check scratch resistance, repeated-touch endurance, and cleaning exposure. Lower cost is tempting. It is not always cheaper over three years. Procurement teams should request sample units, calibration data, and failure-rate evidence before approval. Some specifications remain incomplete, and that deserves honest scrutiny.
Performance figures are typical engineering ranges for commercially available conductive-glass touch technologies. Actual results depend on display size, cover-glass thickness, sensor stack-up, controller firmware, grounding, operating temperature, moisture, glove type, and manufacturing tolerances. Cost is a relative comparison for the sensor assembly only: Low, Medium, or Medium–High.
PCAP Benchmarks: 1–10 mm Cover Glass and Up to 10-Touch Input
For global buyers, the strongest PCAP sensor choice depends on cover-glass thickness, touch count, and operating conditions. Seven practical configurations include glass-glass, glass-film, mutual-capacitance, self-capacitance, hybrid, narrow-bezel, and ruggedized conductive-glass sensors. Each can support different display sizes and interface demands. However, “up to 10-touch” usually depends on the controller, electrode layout, firmware, and noise filtering—not the glass alone.
A 1–3 mm cover glass is generally easier to tune for responsive multi-touch input. At 5–10 mm, sensitivity often drops, especially with gloves, moisture, or electromagnetic noise. The 2024 MarketsandMarkets touch sensor report projects strong market growth through 2028, driven by automotive, industrial, and interactive display applications. Omdia’s display research also links larger touch interfaces with expanding vehicle and control-panel adoption. These figures support demand, but they do not guarantee equal performance across suppliers.
The 10 mm benchmark needs caution. It may require stronger drive signals, tighter sensor spacing, and application-specific calibration. In my testing experience, a thick glass panel can feel accurate at the center but unreliable near the edges. That weakness is easy to miss in a showroom. Buyers should request measured latency, ten-finger tracking results, glove tests, moisture tests, and transparent reports under their actual stack-up. Small differences matter.
Global Qualification: IP65/IP67, −20–70°C Operation, and CE/FCC/REACH
7 Best Conductive Glass Display Sensors for Global Buyers
For global buyers, the seven best conductive glass display sensors are not chosen by touch sensitivity alone. Qualification starts with enclosure protection, temperature stability, and documented compliance. IP65 blocks dust and water jets. IP67 adds temporary immersion protection, typically up to one meter for 30 minutes under IEC 60529 testing. That difference matters in outdoor kiosks, factory panels, and washdown areas.
Fortune Business Insights valued the industrial sensors market at USD 28.22 billion in 2023. Its report projects growth to USD 56.93 billion by 2032. This expansion increases pressure on suppliers to prove, rather than claim, environmental performance. A dependable conductive glass sensor should operate from −20°C to 70°C. Buyers should request thermal cycling records, sealing details, and touch-response results at both temperature limits. Small gaps around the glass can become serious failure points.
Compliance needs separate verification. CE marking requires an applicable conformity assessment, while FCC requirements address electromagnetic emissions in relevant markets. REACH supports substance transparency across the supply chain. These are not interchangeable certificates. Ask for test reports, declarations, material disclosures, and revision dates. TÜV Rheinland’s 2024 industry research highlights rising concern about connected-device reliability and documentation quality. I would not accept a polished datasheet alone. It can still hide weak adhesive performance or incomplete EMC testing. Field validation remains necessary, especially where condensation, gloves, or repeated cleaning are expected.
IEC 61000-4-2 Benchmark: ±8 kV Contact and ±15 kV Air ESD
7 Best Conductive Glass Display Sensors for Global Buyers
IEC 61000-4-2 Benchmark: ±8 kV Contact and ±15 kV Air ESD
The best conductive glass display sensors manage touch accuracy and electrostatic stress together. Seven practical choices include single-layer projected capacitive, mutual-capacitance, self-capacitance, glove-touch, wet-finger, thick-cover-lens, and rugged bonded designs. Each suits a different installation condition.
IEC 61000-4-2 testing requires ±8 kV contact discharge and ±15 kV air discharge at defined points. Contact testing is repeatable. Air testing is less predictable because the spark gap changes. Engineers should inspect the sensor, bezel, controller, cable, and enclosure as one system. A conductive glass layer alone cannot guarantee compliance.
Look closely at glass thickness, coating uniformity, edge insulation, grounding, and adhesive coverage. A proper test report should identify discharge points, polarity, repetitions, operating mode, and recovery time. Ask whether the display remains responsive after each pulse. It matters.
A rating can still hide weaknesses. Some samples recover slowly after a bezel discharge. That detail is easy to miss. My own selection bias would favor thinner glass for clarity, yet thicker glass may improve mechanical protection. Buyers should compare real test data, not only a supplier’s headline voltage. Temperature, humidity, gloves, and cable routing can change results across markets.
7 Best Conductive Glass Display Sensor Architectures for Global Buyers
IEC 61000-4-2 benchmark: ±8 kV contact discharge and ±15 kV air discharge
The chart compares commonly used conductive glass display sensor architectures against the IEC 61000-4-2 reference stress levels. The values represent standardized test voltages, not product performance rankings. Actual ESD results depend on electrode layout, glass stack-up, controller protection, enclosure design, grounding, and test setup.


 Phone
Phone Send Email
 whatsapp
 Facebook